Linear Regression
This post discusses Linear Regression in simple terms using accessible language for all.
Linear Regression
What is Regression?
Regression is a statistical technique used to understand the relationship between one or more independent variables (predictors) and a dependent variable (outcome). Think of it as a way to predict or explain changes in the outcome based on changes in the predictors.
Simple Example
Imagine you want to understand how the number of streetlights in different neighbourhoods impacts the number of reported assaults. You can analyse data from various neighbourhoods, plot the number of assaults against the number of streetlights, and see if there’s a pattern.
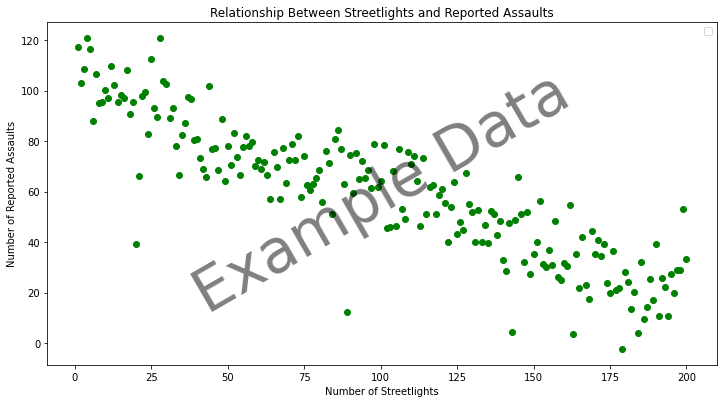 Plot Showing the Number of Streetlights in a Neighbourhood Against the Number of Assaults Reported
How Does Regression Work?
Think of regression as drawing a straight line through a set of points on a graph where each point represents data from a different time or place. The regression line shows the general trend. So for the graph above adding a regression line can help predict future assaults if the number of street lights was to increase or decrease. Below we can see that as the number of street lights increases the number of assaults decreases – this is the general trend.
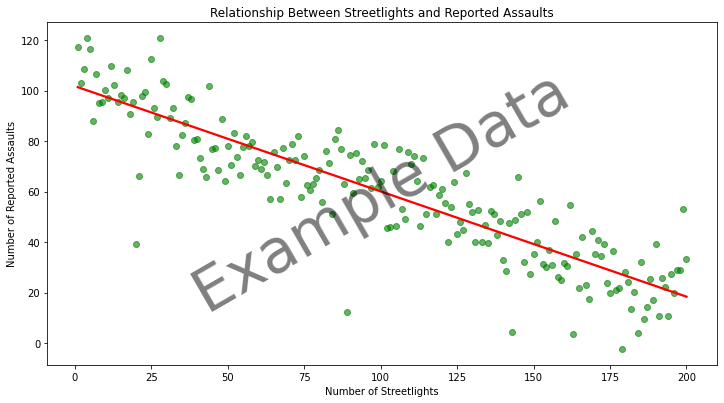 Plot Showing the Number of Streetlights in a Neighbourhood Against the Number of Assaults Reported with a Regression Line
You can also extend this to make predictions involving multiple factors or independent variables like unemployment rates, police presence, and average income. A linear regression would help determine how each factor affects the dependent variable (number of assaults) and to what extent.
What Can Linear Regression Tell Us?
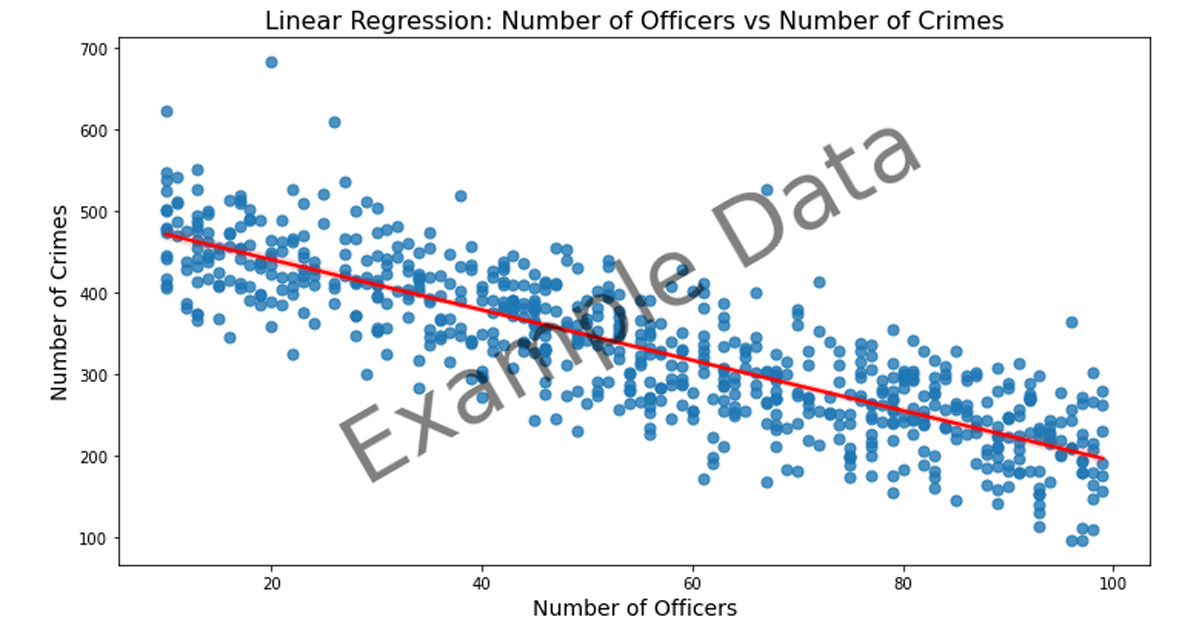
You can use a linear regression when you want to predict how one factor, like the number of police patrols, or a set of factors might affect another, like the number of crimes in a neighborhood. It’s helpful when you expect a steady, predictable relationship between the two factors.
Practical Use of Regression Models
Policy Making:
- Helps understand which factors most influence outcomes and thus guides decision-making.
- Example: If the model shows that increased police presence significantly reduces crime rates, it might justify allocating more resources to police.
Predicting Future Trends:
- Can be used to forecast future outcomes based on current or planned changes in predictors.
- Example: Predicting how future changes in unemployment might affect crime rates.
What Linear Regression Can’t Do
Linear regression can’t tell you why the relationship exists, only that it does. For example, it can’t explain why more officers might reduce crime—just that, historically, this trend has been observed. Also, it may not work well if the relationship between the variables isn’t straightforward or linear.
Key Takeaways
Regression is a powerful tool to understand and predict how different factors impact a particular outcome. It provides insights that can help in making informed decisions, although it’s important to interpret results carefully and be aware of the model’s limitations.
- Linear regression helps predict how one factor, like police presence, might affect another, like crime rates.
- It’s useful for understanding trends but doesn’t explain the cause of those trends.
- Best used when you expect a straightforward, predictable relationship between two factors.
Glossary of Terms
- Predict: To estimate what will happen in the future based on current or past information.
- Trend: The general direction in which something is developing or changing.
Advanced Topics
Limitations
Correlation vs. Causation:
- Regression shows relationships but doesn’t prove one variable causes another. Be cautious of assuming causation from correlation alone.
Model Assumptions:
- Regression models assume linear relationships and other conditions which might not always hold true in real-world scenarios.
Interpreting Regression Results
Coefficients:
- Each predictor has a coefficient, which shows how much the outcome is expected to change with a one-unit change in the predictor.
- Example: If the coefficient for police presence is -0.5, increasing police presence by one unit (e.g., one additional officer) is associated with a decrease in crime rate by 0.5 units.
R-squared (R²):
- Indicates how well the model explains the variation in the outcome. An R² of 0.8 means 80% of the variation in the crime rate is explained by the predictors in the model.
P-values:
- Help determine if the relationships observed are statistically significant or if they might have occurred by chance.